China’s cement industry under the Belt and Road Initiative
 Xinhua News Agency
 Council on Foreign Relations
 Xinhua News Agency
 IMF – WEO (Jan. 2020)
 China Global Investment Tracker
 China Global Investment Tracker
 NBSC, OneStone Research
 CNBM
CNBM
 OneStone Research
 OneStone Research
 Conch Cement
 Conch Cement
 Hongshi Group
 Huaxin Group
 CNBM
CNBM
China’s Belt and Road Initiative, also referred to as the New Silk Road, is the most ambitious and probably the most interesting infrastructure project in the 21st century. This article will describe China’s plan for their new silk road, the economic and geostrategic factors and influences and its impact on the cement industry in China and abroad.
1 The New Silk Road
China’s Belt and Road Initiative (BRI), formerly known as “One Belt One Road”, is an economic investment strategy adopted by the Chinese Government to link China to Central Asia, the Middle East, Russia and Europe via the Silk Road Economic Belt which includes land and rail routes, and the Maritime Silk Road, linking China with South East and South Asia, Africa and Europe (Figure 1). This concept was introduced by President Xi Jinping during his visit to Kazakhstan in September 2013. The original Silk Road arose during the westward expansion of China’s Han Dynasty, which ruled China from 206 B.C. to 220 A.D. The Silk Road routes between China, Central Asia and Europe remained in use until 1453 A.D. for valuable Chinese silk, jade, spices and other goods traded to Europe and gold, other precious metals, ivory and glass products traded to China. Use of the route peaked during the first millennium.
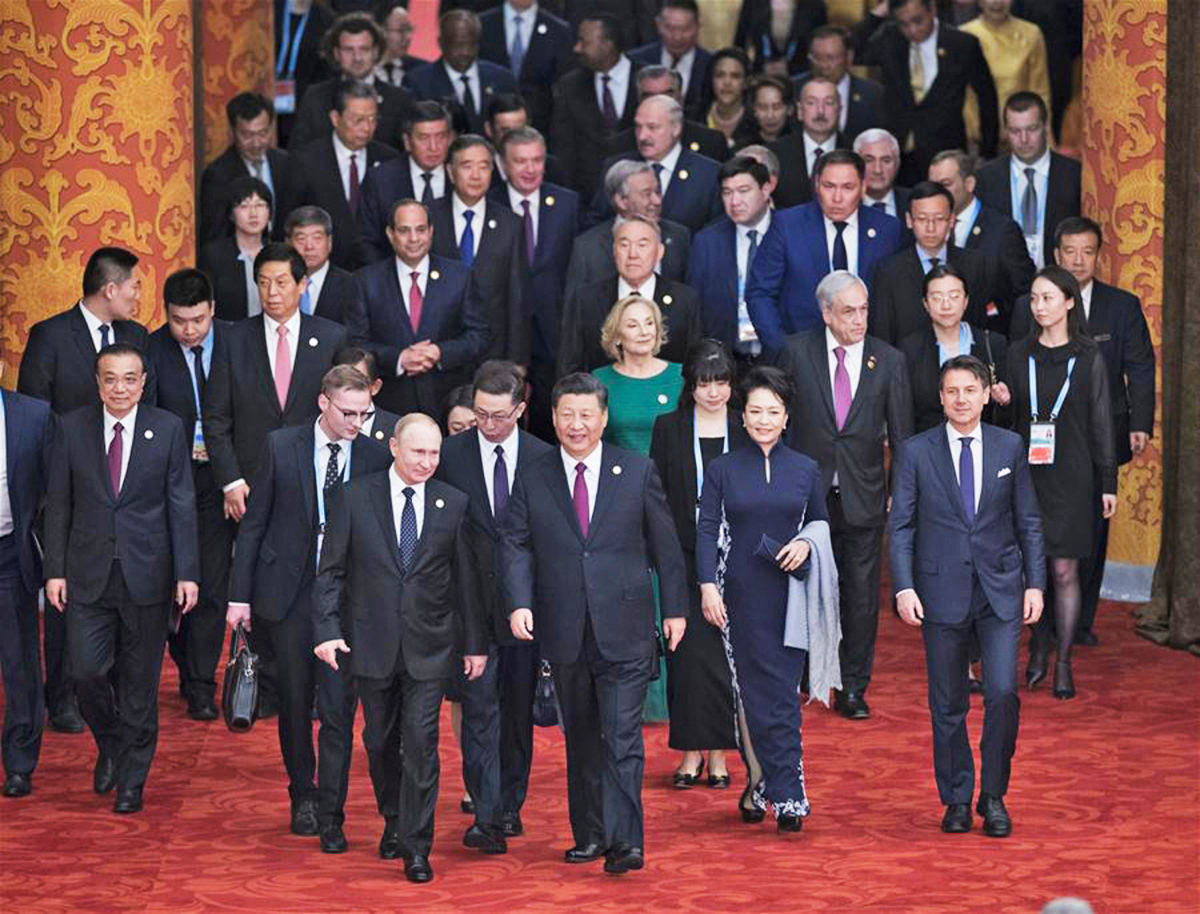
China has invited almost 150 countries to participate in the project. Some 65 % of the global population is affected by the BRI, together with 40 % of the world’s GDP and 34 % of all trade worldwide (data 2017). According to the state-run Xinhua news agency, so far China has signed more than 130 cooperation documents on the Belt and Road development with 105 countries in Asia, Africa, Europe, Latin America, and the South Pacific region, and 26 such documents with international organizations. In 2019, China hosted a second BRI forum in Beijing (Figure 2), with leaders of more than 40 countries and organizations, including those from Russia, Pakistan, Turkey, Kazakhstan, Uzbekistan, Kyrgyzstan, Belarus, Italy, Spain, Greece, Poland, Hungary, Czech Rep., Austria, Switzerland and many others, including Indonesia, Malaysia, the Philippines, Thailand, Singapore, Vietnam, Egypt, Ethiopia, Kenya, Argentina and Chile as well as the UN, World Bank, IMF, EBRD and WTO.
2 Economic and geostrategic outlook of the BRI
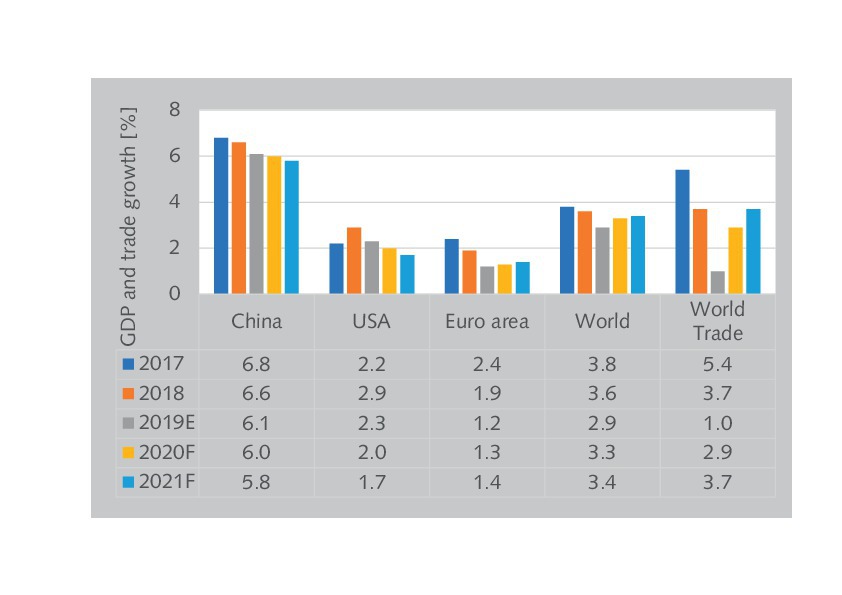
As China’s economy is closely connected with the world economy, the New Silk Road aims to promote the connectivity of Asian, European and African markets and strengthen partnerships among the participating countries. The GDP growth in China has been declining in the last few years. However, in 2019 a growth rate of 6.1 % was still achieved (Figure 3), producing a GDP of 14.38 trillion US$ and for the first time more than 10000 US$ per capita. In comparison, the USA and the Euro Zone achieved a GDP growth of only 2.3 and 1.2 %, respectively. The world trade growth declined significantly to only 1.0 %, after 5.4 % in 2017 and 3.7 % in 2018. China is very much dependent on exports. The overall value of Chinese imports and exports increased by 3.4 %, with the exports growing by 5 % while the imports achieved only 1.6 %. By the end of 2019 China had a population of 1400 million, an increase of about 4.7 million. The urbanization rate is 60.6 %.
Xinhua reported that trade with BRI partner countries posted robust growth in 2019, against economic headwinds and decreasing global trade volumes. Trade with the countries participating in BRI totalled 9.27 trillion yuan (about 1.34 trillion US$), which is up 10.8 % on the previous year and already makes up 29.4 % of the Chinese trade. The World Bank suggests that infrastructure improvements due to the BRI, combined with more efficient cross-border trade, could lead to a worldwide increase in exports of 3.8-17 % [1]. Furthermore, the travel times for trade along BRI economic corridors could decline by 12 % and by 3 % with the rest of the world, thus reducing trade costs significantly [2, 3]. As one example, the travelling time for computers produced in Chongqing for Germany and France will only be 12 days instead of the previous eight weeks. And finally, a deeper integration could boost real incomes globally by up to 2.9 % and thus increase demand.
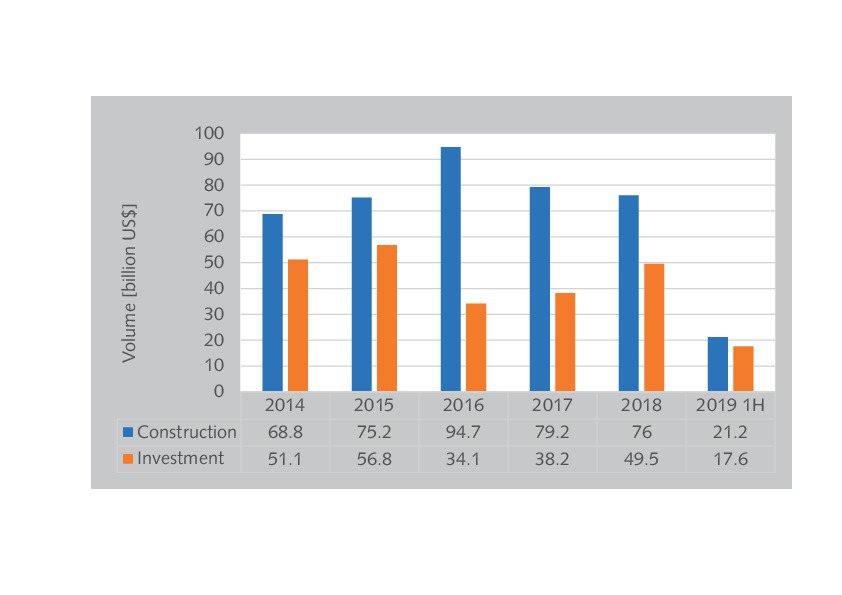
According to Morgan Stanley, the BRI is estimated to cost 1.2-1.3 trillion US$ by 2027. China plans to build fifty special economic zones, modelled after the Shenzhen Special Economic Zone, which China launched in 1980 during its economic reforms under Deng Xiaoping. Up to now, construction spending outpaces the amount of Chinese investment in the BRI, due to both commercial and political reasons. Figure 4 shows the BRI construction spending by year and the corresponding Chinese investment. Up to now the peak spending year was 2016, while the peak funding year was 2015. Funding may have fallen in subsequent years due to competing demands on China’s foreign exchange reserves. However, the number of construction projects in the first half of 2019 fell by about 40 %, while the volume of Chinese funding fell by almost 14 US$ billion in the same period.
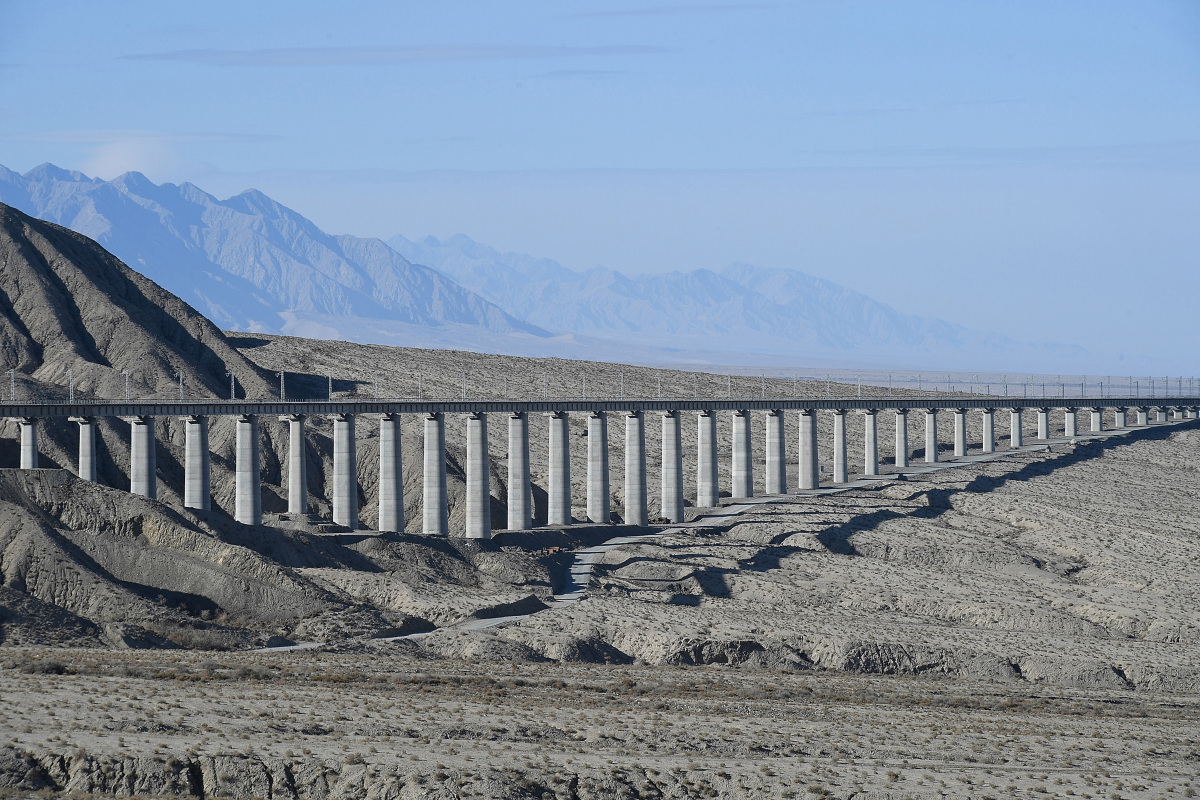
Of the total of 415 US$ billion on construction projects through June 2019, about 349 US$ billion or 84.1 % were awarded to Chinese contractors. The overwhelming number of these construction contracts are given to Chinese state-owned enterprises (SOE). Such SOEs carry out contracting around the world, both within and outside the BRI framework. Figure 5 shows a breakdown of the SOE contracts by type of project. About 164 US$ billion are for energy generation and supply, including 40 US$ billion for hydroelectric dams mainly in Pakistan, Indonesia and Laos, and 35 US$ million for new coal-fired power. Of the 140 US$ billion in the infrastructure sector, 59 US$ billion are for railroads, 47 US$ billion for roads and 21 US$ billion for harbours and other maritime projects. Finally, the 45 US$ billion in the construction sector comprises housing, cement plants and other form of construction.
3 Situation of the cement industry in China
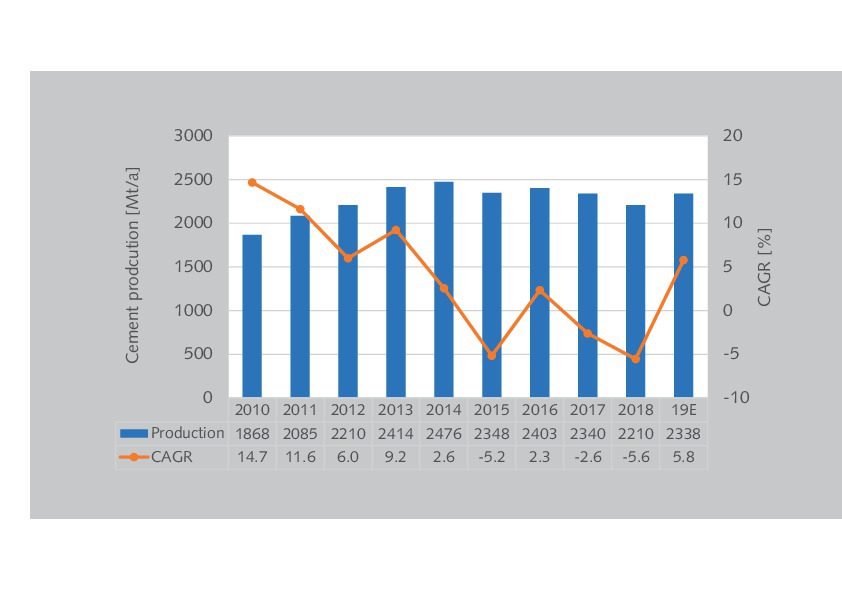
In 2019, despite rising international concern, China’s economy maintained a development momentum with GDP growing at 6.1 % year on year. Fixed-asset investment rose by 5.5 % in the first 8 months, presenting a steady growth momentum. In particular, infrastructure investment grew 4.9 % in the first nine months with a rebounded growth rate. Property development investment grew 10.5 % in the first eight months, maintaining a strong growth momentum. Accordingly, in 2019, after two years of decline (Figure 6), the cement demand achieved a comparatively large growth, supported by the massive real estate investment and driven by an enhancing infrastructure. Cement production in the PRC increased by 5.8 % to an estimated volume of 2338 million tons (Mt/a), which is still well behind the peak production in 2016.
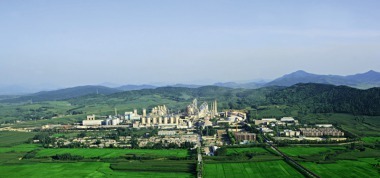
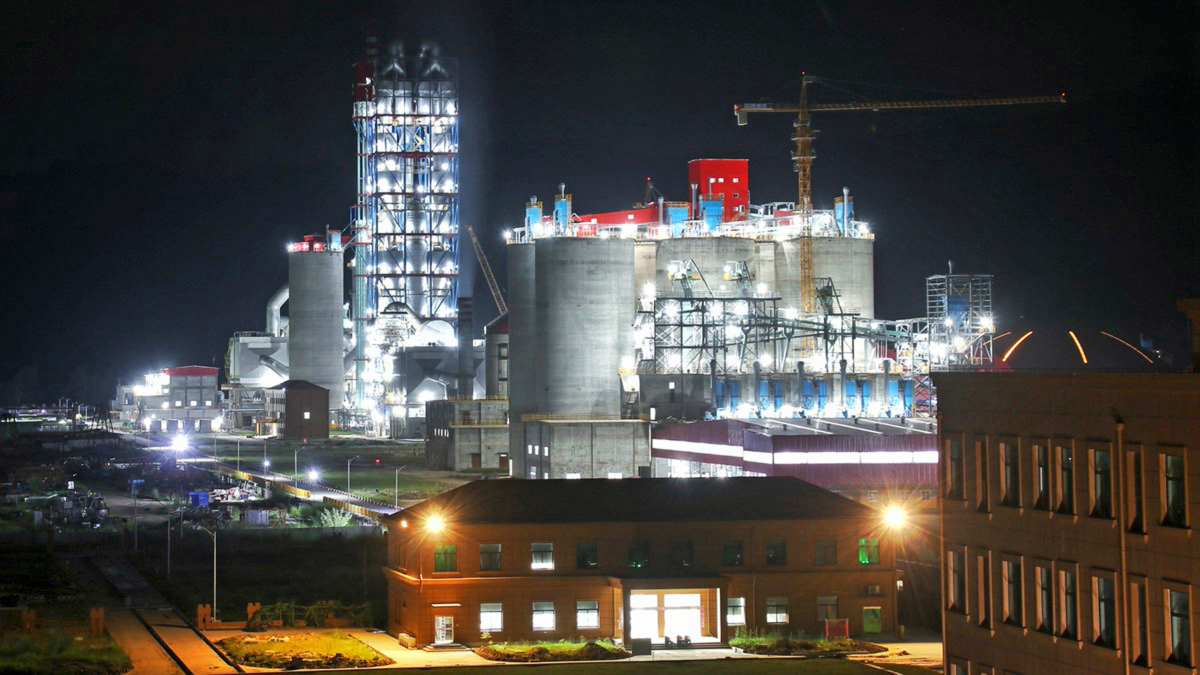
Interestingly, in 2018, despite the cement production decline by 5.6 % to a volume of 2210 Mt/a, the industry profit of the cement industry increased by 76.3 % year on year to RMB 154.6 billion. In that year, the national clinker production amounted to 1420 Mt/a, representing a year-on-year increase of 3.6 %. The two market figures for the cement and clinker production result in a clinker factor of at least 64.3 %, which is much higher than other figures published before, which stated that the clinker factor in China will be well below 60 %. Furthermore, it can be anticipated that the clinker factor is even higher, because at least 12.7 Mt/a of import clinker have been used in China’s cement production. The China National Buildings Material Co. (CNBM, Figure 7), which is by far the largest cement producer in China and also worldwide, produced about 333.8 Mt/a of cement in 2018 and 276.4 Mt/a of clinker, of which 35.2 Mt/a were separately sold, according to our analysis. Accordingly, CNBM achieved a clinker factor of just 72.3 %.
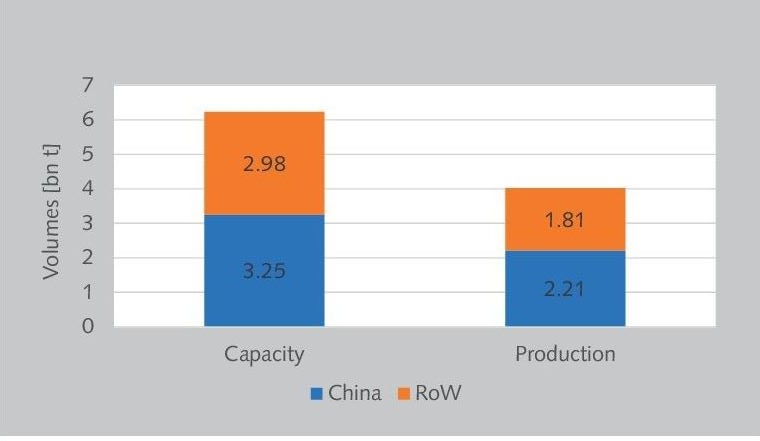
With a cement capacity of 521 Mt/a and a cement production of 333.8 Mt/a, CNBM achieved a cement capacity utilization of 64.1 % in 2018. Figure 8 shows the cement capacity and production of China for the year 2018, compared to the Rest of the World (RoW). The total world cement capacity was 6230 Mt/a, the global cement production was 4020 Mt/a, resulting in an average global capacity utilization of 65 %. China, with 3250 Mt/a capacity and 2210 Mt/a cement production, achieved a capacity utilization of 68 %, while the RoW only achieved a capacity utilization of 61 %, from 2980 Mt/a capacity and 1810 Mt/a production. Anyhow, a further decline of China’s cement production can be projected to a level of 1600 Mt/a by 2030, which corresponds to a decrease of almost 750 Mt/a from today’s level. Accordingly, the cement industry in China will have a downward pressure.
The overcapacity of the cement industry has not been resolved fundamentally and supply-side structural reform remains as the major task. Almost five years ago, the Chinese government had already demanded a supply-side reform of the cement sector. With the promulgation of the “Guiding Opinions on Promoting Steady Growth, Structural Adjustments and Efficiency Enhancement of the Building Material Industry” (Guo Ban Fa [2016], No. 34), new guidelines were issued. These guidelines requested the control of new production capacity, the elimination of outdated production lines, the encouragement of industry consolidation and restructuring, the promotion of off-peak production policy and the self-discipline of manufacturers. Peak shifting production (PSP) was introduced and some provinces and cities ceased to undertake the transfer of cement industry or exited the industry. The Standardization Administration of China implemented the abolishment of PC32.5R cement on 01.10.2019.
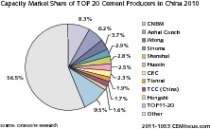
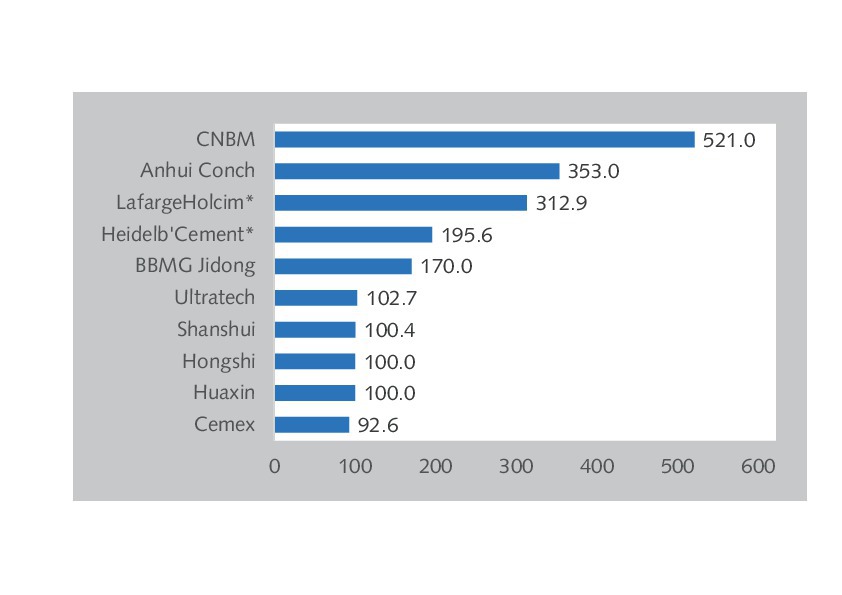
The encouragement of industry consolidation led to a rising concentration in China’s cement industry. In 2017, China’s TOP10 cement producers accounted for almost 60 % in terms of clinker capacity. The target is for China’s TOP10 to reach 80 % by 2020. After the merger of CNBM with Sinoma and that of BBMG (Beijing Building Materials Group) with Jidong Cement and a large number of smaller acquisitions, this goal is nearly achieved. Just the two largest cement producers CNBM and Conch Cement control 65 % of clinker production capacity in ten of the largest cement provinces. In the global ranking, six of the TOP10 cement producers are from China (Figure 9). CNBM and Conch Cement are even bigger than LafargeHolcim and HeidelbergCement after the acquisition of Italcementi. The other Chinese producers in the global TOP 10 are BBMG Jidong, Shanshui, Huaxin and Honghshi, each one having at least 100 Mt/a of cement capacity.
4 Cement capacity expansion under BRI
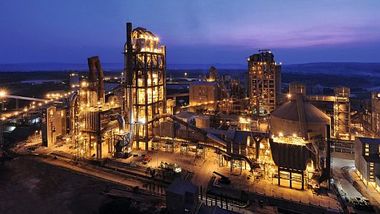
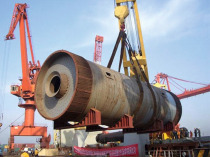
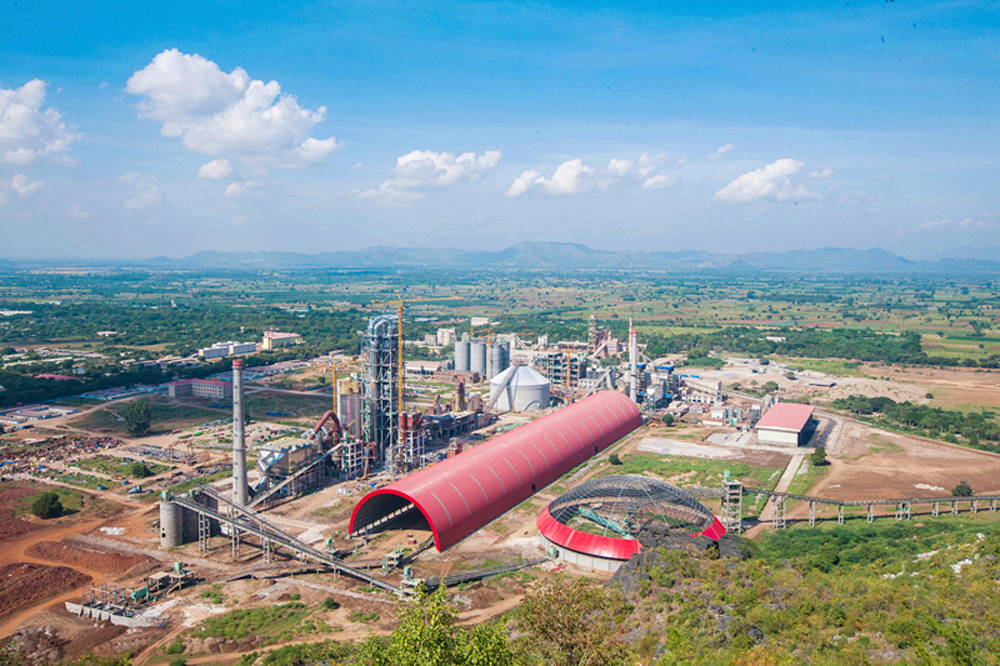
China’s overseas cement industry plans date back to the year 2010/2011 [4]. According to our research, by April 2017 about 37 production lines were implemented overseas, of which seven at that time were under construction, comprising 23 Mt/a of clinker capacity and about 40 Mt/a of cement capacity [5]. Today, the overseas cement capacity influenced by Chinese producers is more than 50 Mt/a and much more is still to come. At the moment only four of the TOP cement producers are actively and steadily implementing their internationalization development strategies despite low financial returns and probably no short pay-back periods. But not only the installation of new plants is targeted. Suitable targets are also mergers & acquisitions and other projects such as BOT and BOOT transfer schemes. Anhui Conch Cement (Conch Cement, Figure 10), CNBM, Honghsi and Huaxin are leading the field:
With more new projects put into operation, Conch Cement continues to lead the overseas expansion. By the first half of 2018, Conch had implemented 17 projects in Cambodia, Indonesia, Myanmar, Laos and Russia, with a total clinker capacity of 20 Mt/a, and established 15 companies with a total investment of almost 10 billion yuan. Myanmar Conch (Figure 11), which is located at the Kyaukse industrial zone, about 70 km from Mandalay City in Myanmar, has become the country’s leading manufacturer and exporter of ALPHA brands. PT Conch South Kalimantan and PT Conch Indonesia were the other main operational plants. Furthermore, the Group completed and commissioned two clinker production lines, each with 5000 t/d, and four cement grinding units at Battambang Conch in Cambodia and PT North Sulawesi Conch in Indonesia. In 2019, Luangprabang Conch in Laos and Barru Conch in Indonesia were constructed and work has also started for Vientiane Conch in Laos.
Conch Cement is also progressing with the expansion to Russia and Uzbekistan. In Spring 2018, Conch decided on the construction of a cement plant in the Ulyanovsk Region in Russia. The plant’s capacity will be 5000 t/d. The project “Volga Conch” will consist of three phases, with an initial investment of 50 billion rubles. The plant is expected to be finished by 2021. According to the Russian news agency TASS, a few years ago another project in Russia was announced for construction in the Sverdlovsk Region for US$ 300 millon. However, up to now, no project progress has been reported. Conch has started with preliminary works for the Qarshi Conch project in Uzbekistan. Commissioning of the new 3200 t/d plant is planned for December 2020. The project required an investment of US$ 150 million.
The Hongshi Group, which is the holding enterprise for more than 20 cement companies in Zhejiang, Jiangxi and ten other provinces, with a combined cement capacity of about 100 Mt/a, is actively responding to the Belt and Road Initiative. It has constructed five large-scale cement factories in Laos, Nepal, Indonesia and Myanmar with a total investment of about 2 billion US$. 350 US$ million were invested in the Nepal project (Figure 12)
with an annual output of 2.3 Mt/a, while 300 US$ million were invested in the Laos projects with 2 Mt/a capacity. The Vientiane project in Laos with a capacity of 5000 t/d was the first completed BRI project of the group. The Indonesian Renma project, which became operational in 2019, needed an investment of 350 US$ million. Other projects such as the Myanmar Binyang plant are close to being completed, while several other cooperation agreements have become an important part of the company’s overseas strategy.
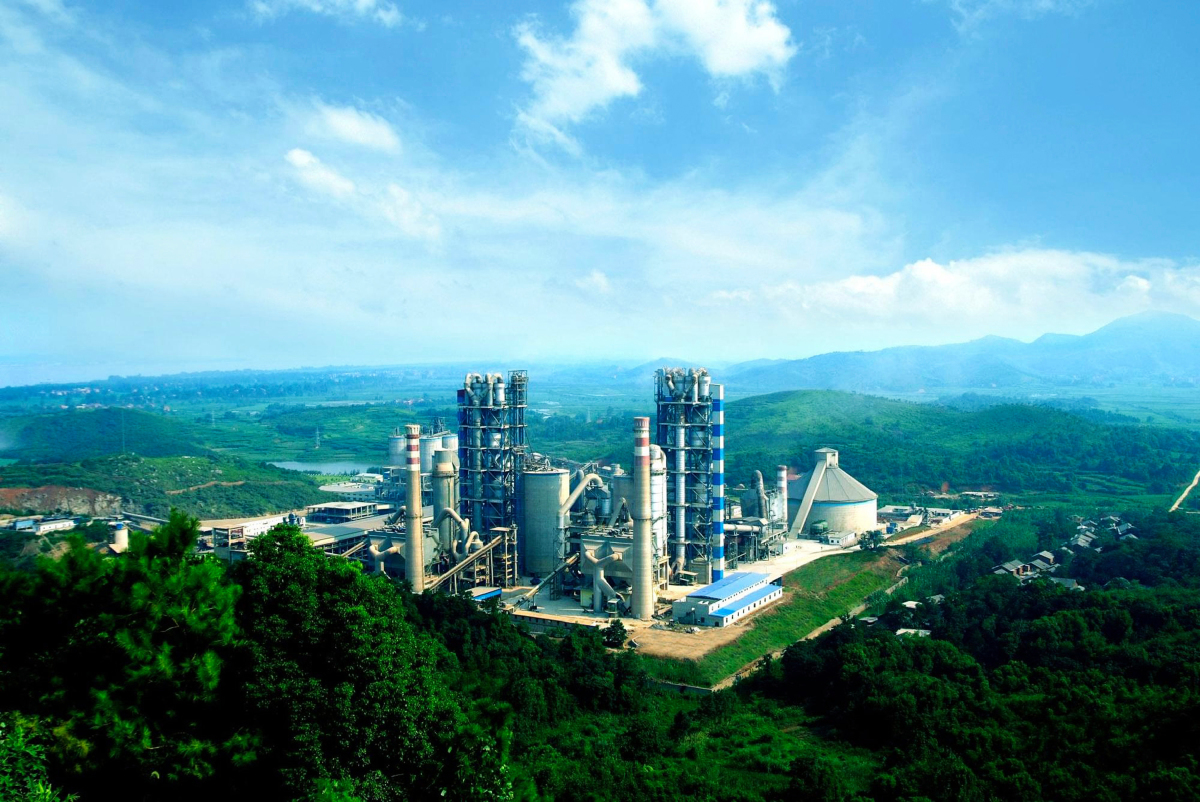
Huaxin Cement (Figure 13), in which LafargeHolcim (LH) has a 41.8% stake, made its first overseas projects operational in Tajikistan. The shareholders in the Huaxin Gayur Cement JV are the local Gayur LLC and Huaxin Investment Ltd. The plant has a cement capacity of 1.2 Mt/a and required an investment of 148 US$ million. The second plant, Huaxin Gayur (Sugd) Cement JV, has a production capacity of 1 Mt/a and was constructed for 168 US$ million. The company will further expand to Nepal and Uzbekistan and will replace old capacity in Mainland China in Hubei Huangshi and Yunan Luquan. The Narayani 2800 t/d project in Nepal and the Jizaakh 4000 t/d project in Uzbekistan were completed in 2019. In the overseas projects Huaxin is taking advantage of LH Group’s overseas platform to make Huaxin an influencial and leading cement manufacturer also outside China.
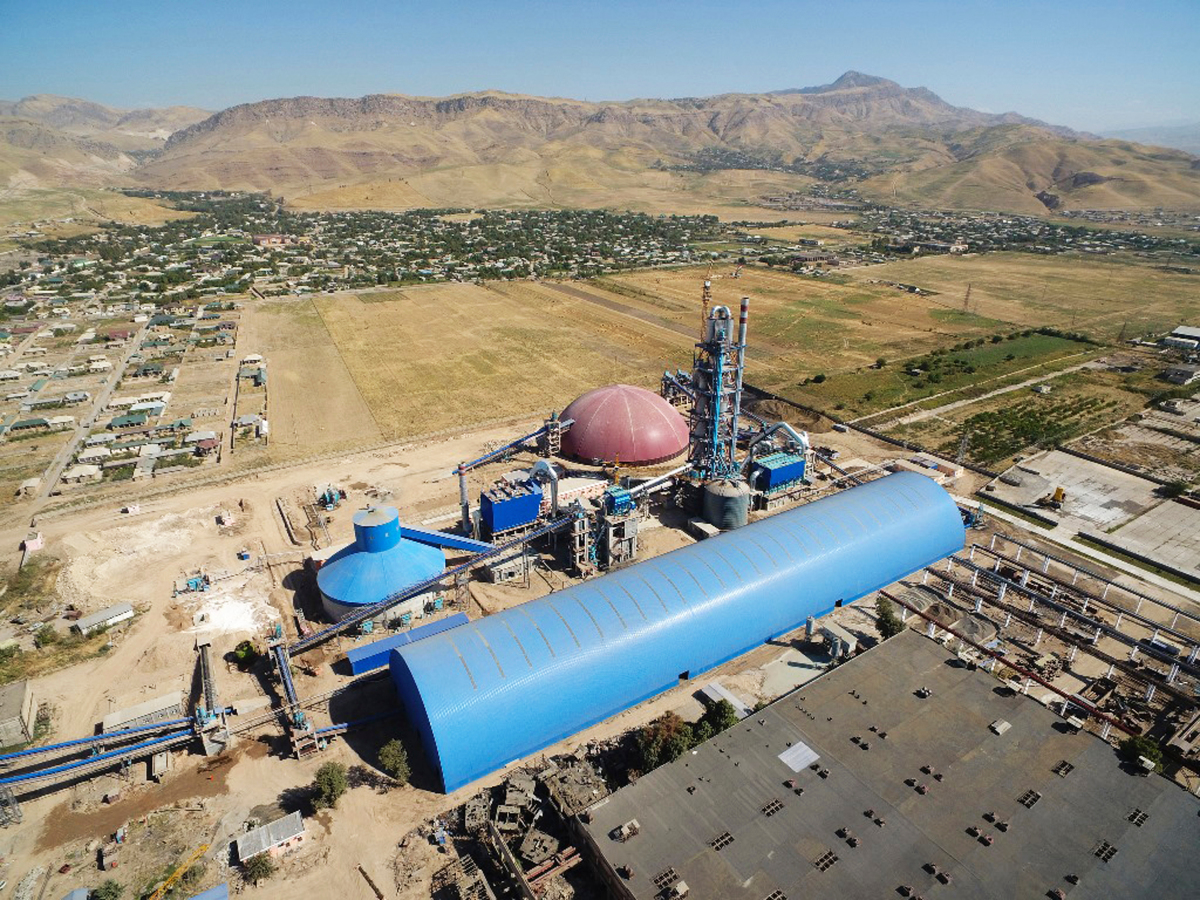
CNBM is performing several overseas projects via the CNBM and Sinoma brands, subsequent to the announcement by Song Zhiping when he attended the annual congress of the World Cement Association in December 2017 in London, that the Group will construct 100 cement factories across 50 countries in Asia and Africa during the next few years. One of these projects is in Tajikistan (Figure 14),
another one is in Zambia. The Zambian plant will be set up in Ndola by Central African Cement, which is part of ZCCM Investment Holdings, and Sinoma, respectively its subsidiary Hengya Cement Co. Ltd. The estimated total investment costs for the 5000 t/d plant are 480 US$ million. The plant will be built on a Buy Operate Own Transfer (BOOT) scheme, Sinoma supplies 60 % of the investment and the cement plant will be owned 100 % by ZCCM-IH after 25 years.
5 Outlook
The overseas expansion of China’s cement industry in line with the BRI initiative is accelerating. However, massive overcapacity issues arise in those countries where Chinese cement producers invest. With increasing problems, Chinese TOP cement producers are reaching a better and better understanding that the market trends in the different regions need to be analyzed closely and that it is no longer possible for one marketing strategy to fit all. Western equipment suppliers are also suffering from the global Chinese expansion, because most of the major groups such as CNBM, Anhui Conch and even Huaxin and Hongshi have their own design institutes. Practically only mid-size clinker plants are being built, 2800 t/d, 3200 t/d, 4000 t/d and 5000 t/d plants. Often these plants are equipped only with Chinese technology. For cement grinding, no vertical roller mills (VRM) are used, but ball mills in combination with high-pressure grinding rollers (HPGR).
//www.onestone.consulting" target="_blank" >www.onestone.consulting:www.onestone.consulting